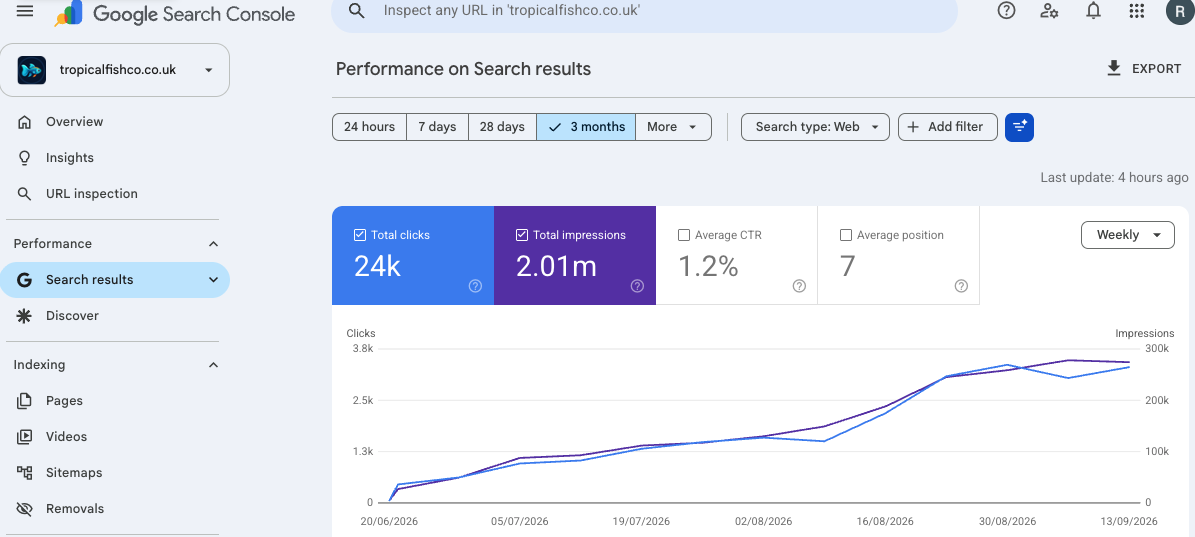
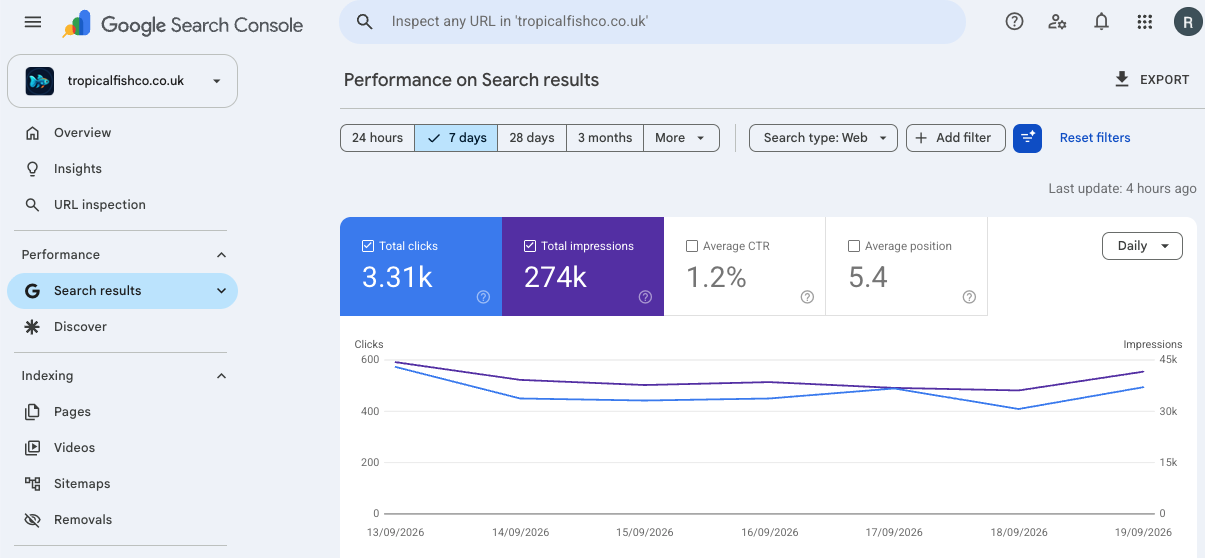
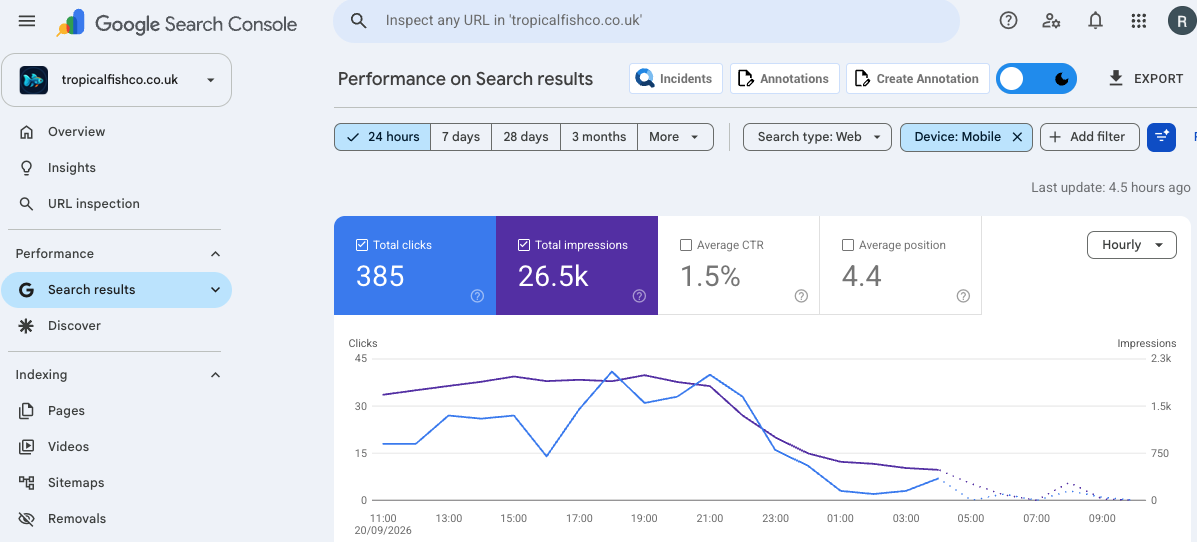
Like-for-like periods use the same property, search type, geography and device scope. All four comparisons below include all devices. The 28-day and 90-day windows overlap and must not be added together.
28 days · all countries
Current: 22 August–18 September 2026
Previous: 25 July–21 August 2026
28 days · all countries search comparison for Tropical Fish Co| Metric | Previous | Current |
|---|
| Clicks | 6,599 | 12,693 |
|---|
| Impressions | 568,161 | 1,047,055 |
|---|
| CTR | 1.16% | 1.21% |
|---|
| Avg. position | 8.21 | 5.98 |
|---|
Click change: +92.3%. Lower average-position numbers mean higher placement within the measured results.
28 days · UK
Current: 22 August–18 September 2026
Previous: 25 July–21 August 2026
28 days · UK search comparison for Tropical Fish Co| Metric | Previous | Current |
|---|
| Clicks | 5,791 | 10,778 |
|---|
| Impressions | 212,223 | 381,206 |
|---|
| CTR | 2.73% | 2.83% |
|---|
| Avg. position | 10.83 | 8.11 |
|---|
Click change: +86.1%. Lower average-position numbers mean higher placement within the measured results.
90 days · all countries
Current: 21 June–18 September 2026
Previous: 23 March–20 June 2026
90 days · all countries search comparison for Tropical Fish Co| Metric | Previous | Current |
|---|
| Clicks | 1,972 | 23,444 |
|---|
| Impressions | 96,329 | 1,967,292 |
|---|
| CTR | 2.05% | 1.19% |
|---|
| Avg. position | 20.28 | 7.04 |
|---|
Click change: +1088.8%. Lower average-position numbers mean higher placement within the measured results.
90 days · UK
Current: 21 June–18 September 2026
Previous: 23 March–20 June 2026
90 days · UK search comparison for Tropical Fish Co| Metric | Previous | Current |
|---|
| Clicks | 1,851 | 20,232 |
|---|
| Impressions | 45,169 | 716,277 |
|---|
| CTR | 4.10% | 2.82% |
|---|
| Avg. position | 26.64 | 9.93 |
|---|
Click change: +993.0%. Lower average-position numbers mean higher placement within the measured results.
What this tells us—and what it does not
The store is building search reach: all-country clicks rose 92.3% across the matched 28-day comparison. As a newer retail brand develops, a small earlier baseline can make longer-period growth look especially large. We show the actual counts rather than claiming that SEO alone caused every additional visit.
These reports measure Google search activity. They do not establish unique customers, completed orders, profit, saved staff hours or a return on investment. Stock, seasonality, brand demand and other marketing can all affect the result.